In this article (and video above), we calculate the maximum shear force and moment resultant from a point load applied to a beam by drawing the shear force diagram and moment diagram associated with the condition. This question forms part of the Structural Mechanics section of the PE Exam and was created and solved by Engineer in training, Enrique Ivers
Question:
For the beam shown, what is the maximum shear force and the maximum moment?


Explanation:
For the beam shown, what is the maximum shear force and the maximum moment?
There are reaction forces resultant from the 40 K point load. We know the distance from pinned support A and point load P. We can easily calculate the distance from P to roller support B.
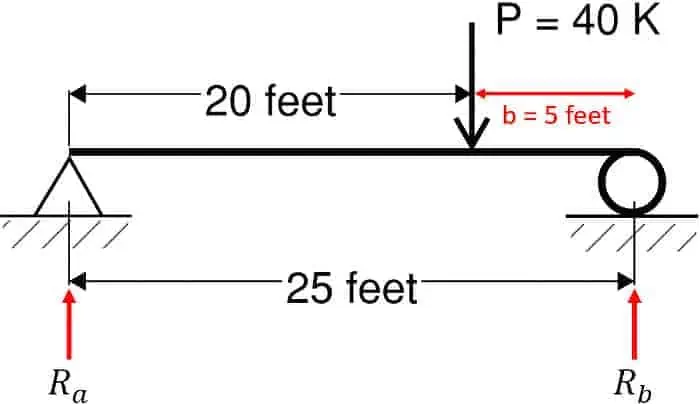
Shear at the left support, Va, is equal to the Reaction force, Ra. This force is calculated by the equation
![]()
where P is the point load, b is the distance between the load and support b, and L is the total length of the beam:

As the forces must be in equilibrium, we know that Rb must be equal to the difference between the Point load P, and Ra: Rb = P – Ra = 40K – 8K = 32K
Similar how Va, Vb= Rb, so the shear force at support B is also 32K.

Although not required for this problem, you may be asked to select the appropriate shear diagram in similar problems.
Recall that shear diagrams are linear whereas moment diagrams are parabolic. In a uniform load, the linear shear diagram will exhibit a non-zero slope.
However, in a case like this one, the shear diagram has a slope of zero, and since we’re “tracing the impact of the load”, the impact of the point load is apparent in the diagram at that specific point.
Let’s take a look!
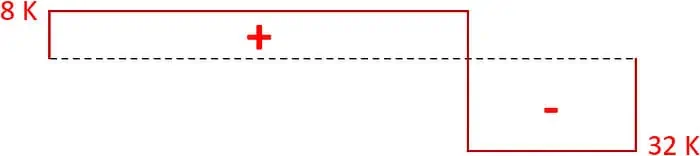
The first load on the structure is Va = Ra = 8 K.
This force is acting upwards, so it raises the shear force diagram from zero to +8 K at point A
![]()
The shear force them remains constant as we move from left to right until we hit the point load of 40 K acting downward.
The first load on the structure is Va = Ra = 8 K.
This force is acting upwards, so it raises the shear force diagram from zero to +8 K at point A.
The shear force them remains constant as we
move from left to right until we hit the point load of 40 K acting downward.
This will cause the shear force diagram to “drop” down by 40 K to a value of + 8 K – 40 K = -32 K
We continue until we hit support B, where
Vb = Rb = 32 K, also pointing upwards. This results in the shear diagram ending up back at zero.
We’ll now calculate the maximum moment. And, as we did an exercise with the shear diagram, we’ll also draw the moment diagram.
We can use the Maximum Moment Equation:
![]()
where P is the point load, a is the distance between support A and the point load, b is the distance between support B and the point load, and L is the length of the beam.
![]()
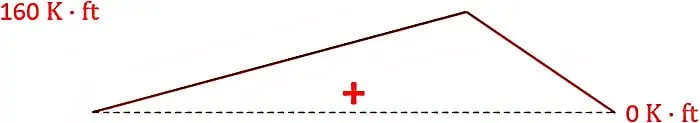
Knowing our maximum moment is 160K·ft, we can draw our moment diagram.
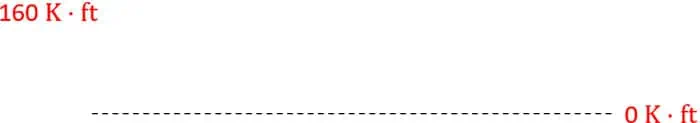
Recall that the magnitude of the moment at the supports will be zero, and the maximum moment coincides with the location of the point load.
Answer:
The correct answer is B.
This Episode Is Brought to You by PPI
PPI has helped engineers achieve their licensing goals since 1975. Passing the FE and PE exams can open doors to career advancement and new opportunities. Check out PPI’s wide range of prep options, including Live Online courses, OnDemand courses, and digital study tools to help prepare you to pass your licensing exam here.
I hope you found this article helpful. In upcoming articles, I will solve some more PE exam practice problems and answer other questions from our subscribers. Pass the PE Exam videos will publish weekly, so be sure to click the subscribe button so you don’t miss something that could make a substantial difference in your exam result.
Lastly, I encourage you to ask questions in the comments of this video, or on this page and I’ll read and respond to them in future videos. So, if there’s a specific topic you want me to cover or answer, we have you covered.
I’ll see you next week… on Pass the PE Exam
Anthony Fasano, P.E.
Engineering Management Institute
Author of Engineer Your Own Success

Leave a Reply